Pratt Center Research
Retrofit Standardization Initiative: Building Type Selection Methodology
Maps | October 1, 2013
Project Overview
New York State's multi-million dollar residential energy efficiency programs are chronically underutilized in New York City. Retrofitting half of NYC’s 650,000 small homes would save homeowners $255 million annually and create 1,500 jobs, but thousands of low- and moderate-income residents in communities burdened by energy costs and an outdated building stock have struggled with securing retrofit financing and taking part in these programs.
To address this, Pratt Center launched an innovative initiative to ramp-up residential retrofits through a simple standard package of five energy efficiency measures that can be implemented in hundreds of thousands of similar small homes without a costly, complicated and time-consuming energy audit. We estimate that by eliminating audits, this standard package can make it easier for community-based organizations to ramp-up retrofits in their communities, easier for homeowners to access retrofit financing, and more profitable for small businesses to implement energy efficiency, while generating more retrofit jobs for local residents. For more information about this project, visit our Retrofit Standardization Initiative page.
While we ultimately seek to apply retrofit standardization to all of NYC's small residential building stock, to first test out this approach we are focusing on one building type that meets three initial criteria: prevalence – a building type that represents a large proportion of the city's building stock; feasibility – a building type in which we could thoroughly analyze energy usage and identify potential retrofit upgrades; and energy efficiency opportunities – a building type that could yield a high rate of return on retrofit investments. To identify such a type, we developed a data-driven building type selection methodology. The maps in this series demonstrate our methodology and visualize the pertinent building and community data that inform our Retrofit Standardization Initiative. The content of these maps and our overall building type selection methodology are summarized below.
Building Type Selection Methodology
In order to identify a residential building type that met our three criteria, we first analyzed building data from the NYC Department of City Planning’s GIS geographic tax lot layer (MapPLUTO), which includes year built, number of floors, number of residential units, Proximity Code (attachment type), and Building Class (a code describing the major use of structures on the tax lot as defined by NYC Department of Finance). With this data, we engaged in an eleven step process to narrow down all of the city’s buildings into a subset of buildings which would be applicable to our study given their size, contiguity, and the State's energy efficiency program guidelines. We removed nonresidential buildings; buildings with more than four families and less than two families; buildings constructed before 1860 or after 1929; buildings with more than five floors; and buildings with more than 10 residential units. This narrowed down the city’s building stock to 165,268 homes.
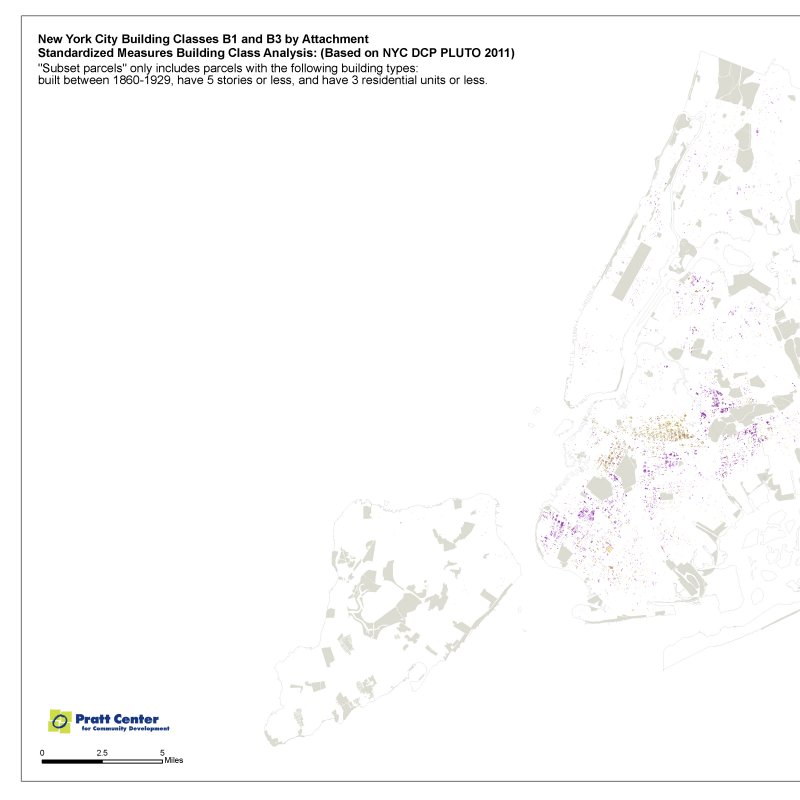
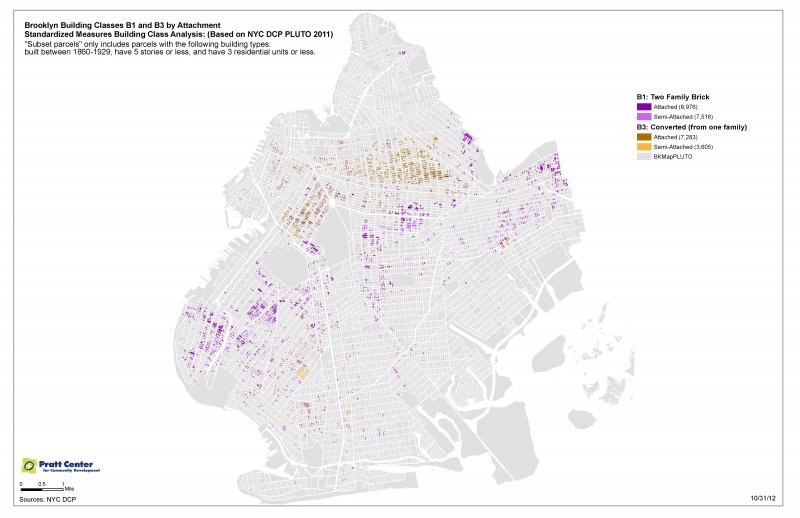
Using data of 14 different Building Classes, we found that homes classified as B1 (Two family brick dwellings), B2 (Two family wood dwellings), B3 (Two family converted from one family), and C0 (Walk-up three family) collectively accounted for over 80 percent of our subset. This analysis confirmed that most small homes in New York City are very similar. We then analyzed the attachment status of these homes by Building Class, focusing specifically on Brooklyn and Queens. The majority were either attached or semi-attached, and given construction patterns in the period between 1860 and 1929, were more likely to have similar building systems than detached homes.
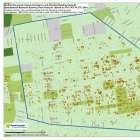
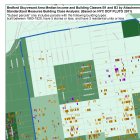
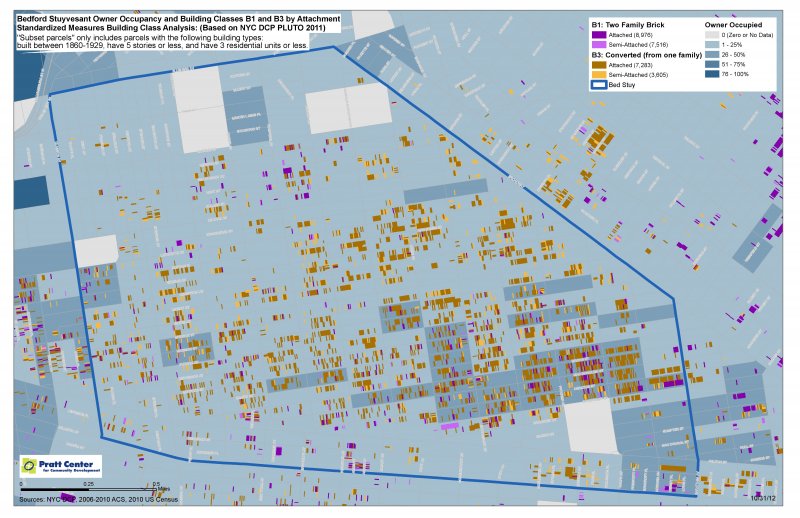
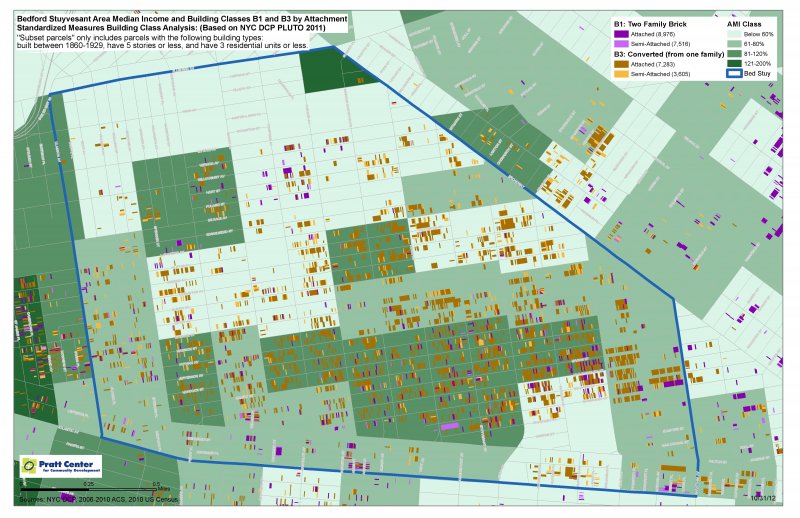
Accordingly, we then mapped the distribution of all attached and semi-attached homes which were classified as B1, B2, B3, and C0 to identify the communities with the densest concentration of these homes. This was followed by an analysis of Area Median Income in these communities to ensure that the study’s focus remained on areas with the greatest need for energy efficiency upgrades. Based on these analyses, we determined to focus largely on Bedford Stuyvesant – the community with the most number of houses in our subset, and the highest concentration of residents below Area Median Income (relative to other communities with numerous B1, B2, B3 and C0 homes).
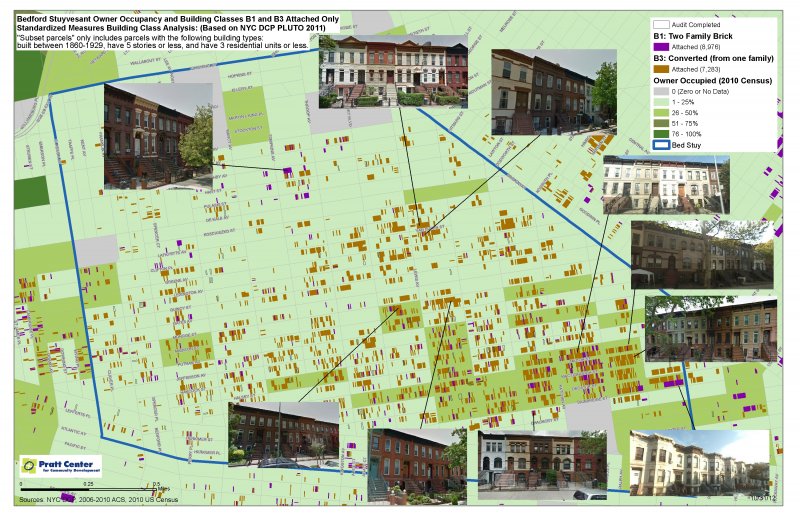
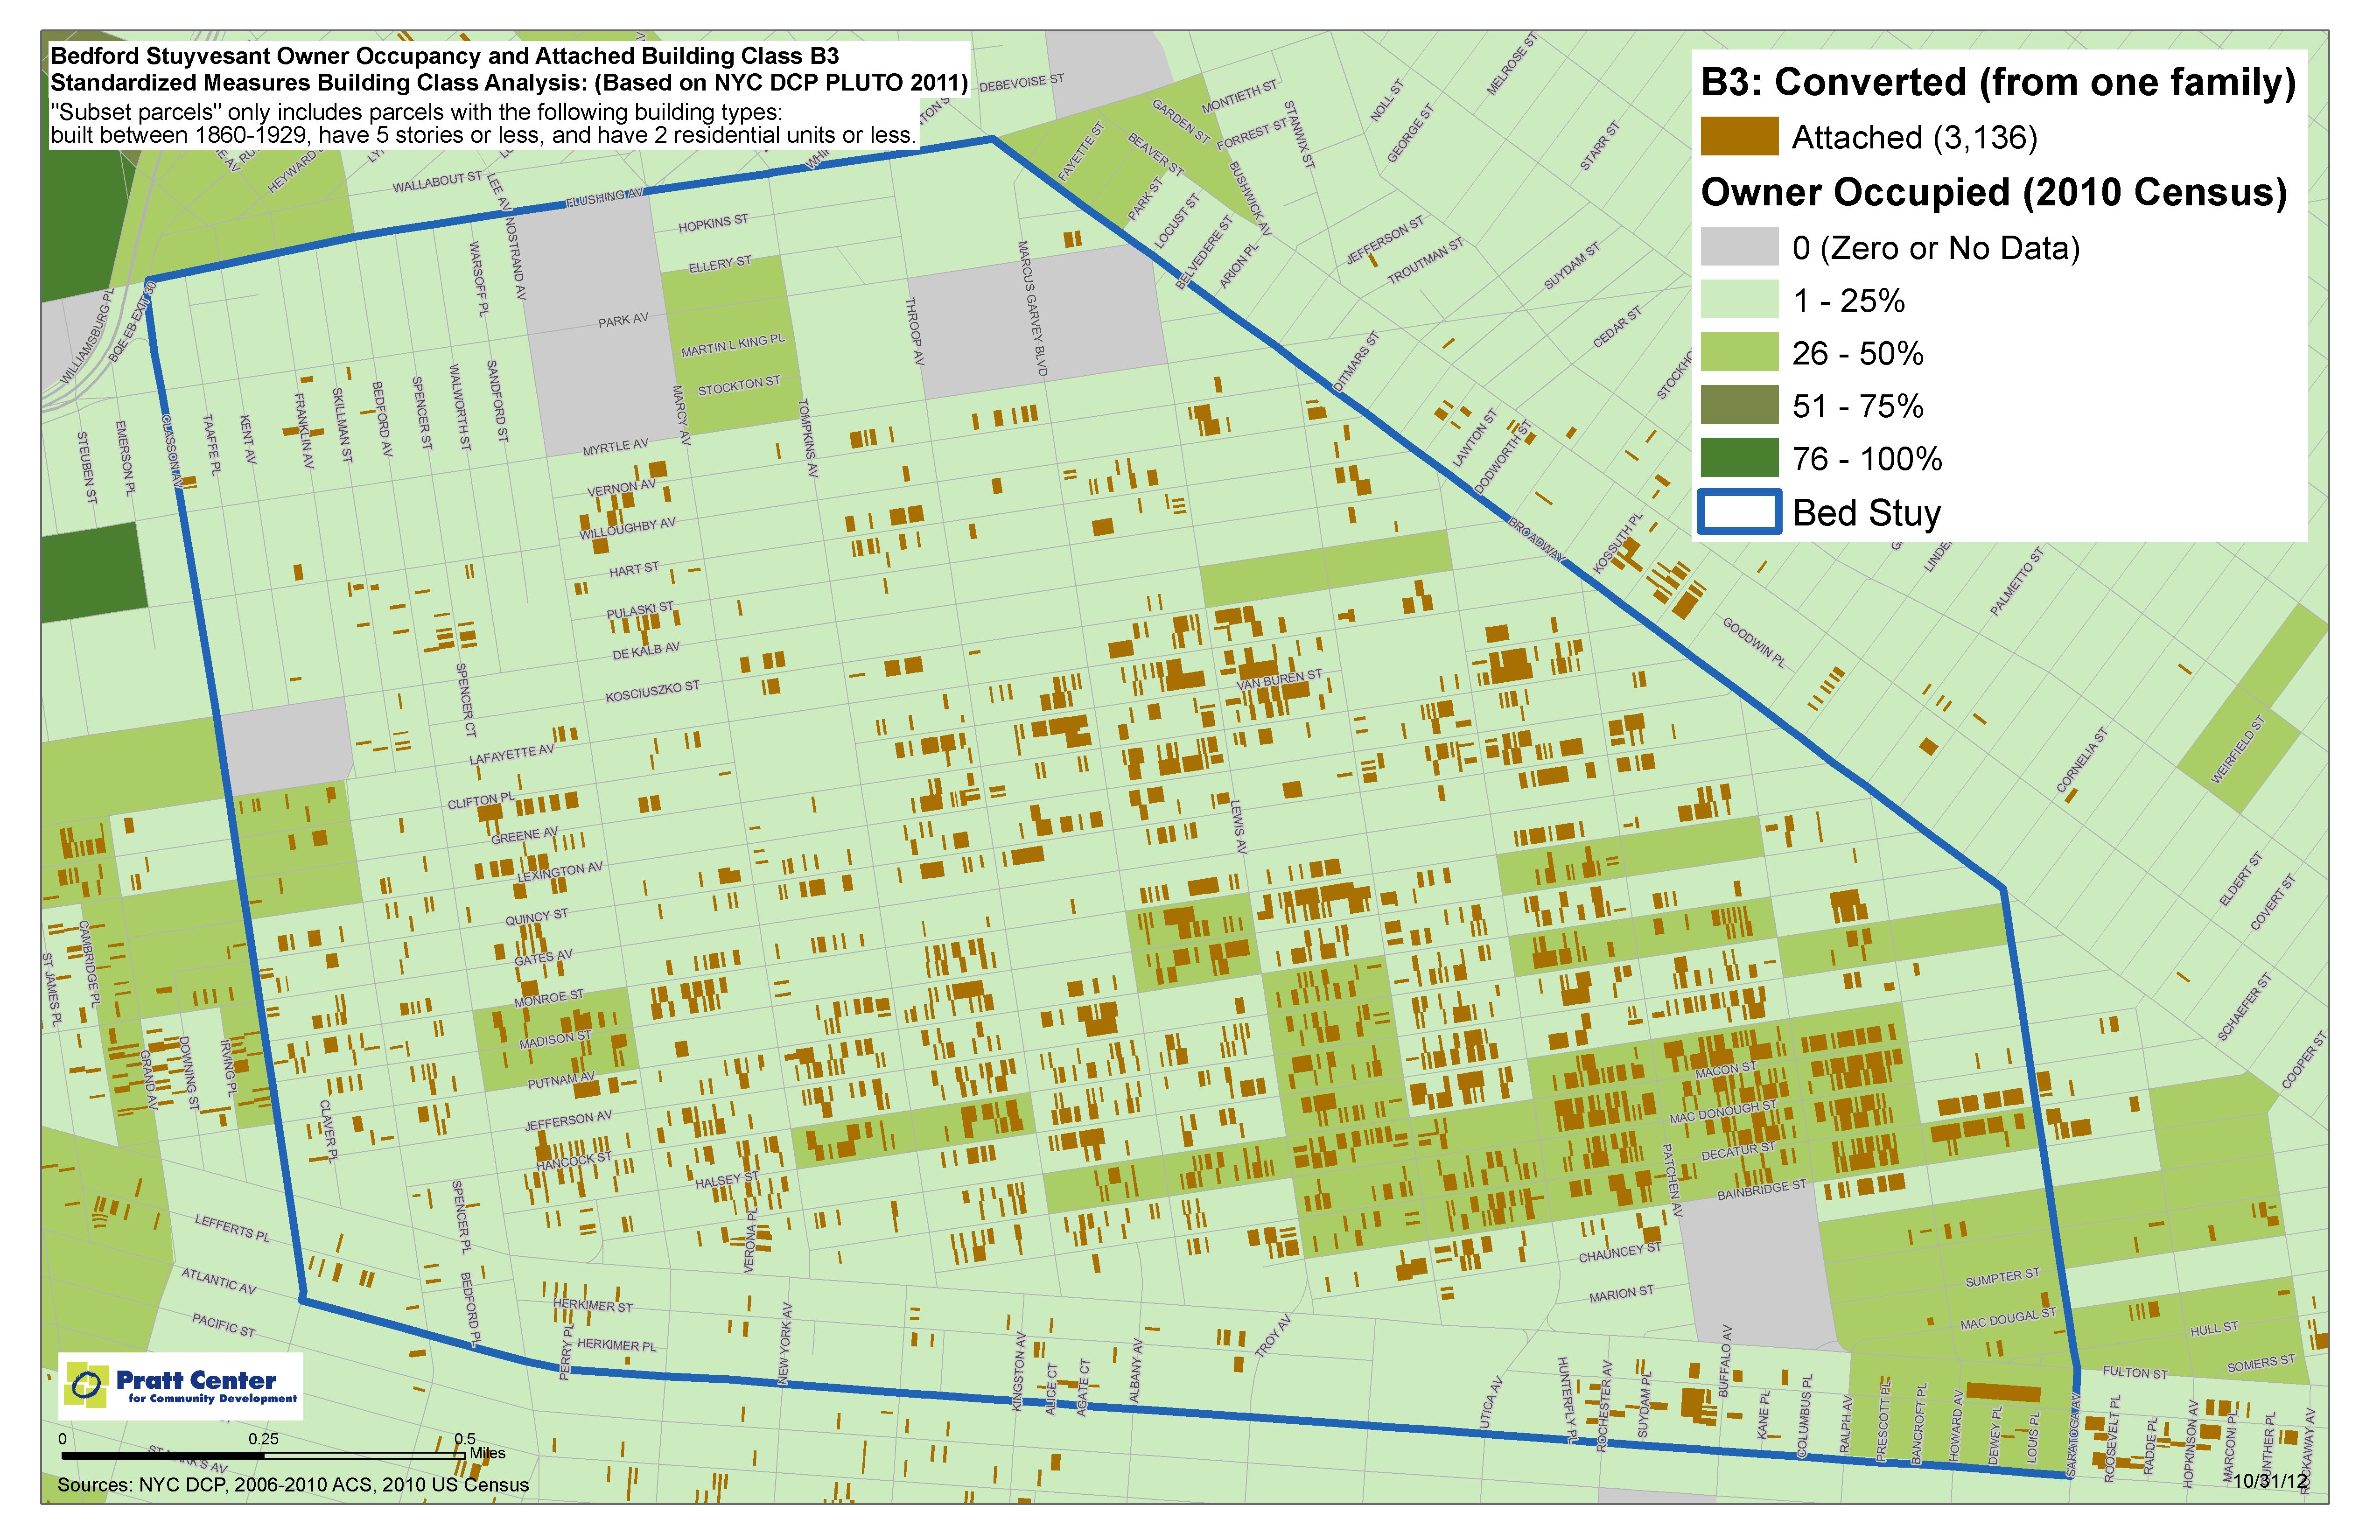
We also determined that B2 buildings were too scattered for us to pursue as the study’s target building type, and decided to eliminate C0 buildings because of the difficulty of recruiting multiple tenants for the initiative's energy assessments in a short timeframe. We additionally learned through the Department of Finance that there is no substantive difference between homes classified as B1 and B3, and thus decided to focus on attached B1 and B3 homes in Bedford Stuyvesant. There are a total of 3,612 attached B1 and B3 homes in Bedford Stuyvesant and 142,946 B1 and B3 homes throughout all of New York City, making this a highly prevalent building type to apply the standard package.
Maps Index
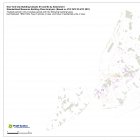
- Citywide Building Classes B1 and B3 by Attachment Status
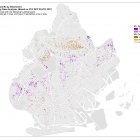
- Brooklyn Building Classes B1 and B3 by Attachment Status
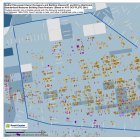
- Bedford Stuyvesant Owner Occupancy and Building Classes B1 and B3 by Attachment Status
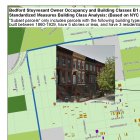
- Bedford Stuyvesant Owner Occupancy and Attached Building Class B3
- Bedford Stuyvesant Area Median Income and Building Classes B1 and B3 by Attachment Status
